HOW TO TRADE BEARISH ALT BAT HARMONIC CHART PATTERN

Bearish alt bat harmonic chart pattern suggests a short entry upon completion of the pattern. It is an XABCD harmonic chart pattern. This post is to explain the way to find or draw a bearish alt bat harmonic chart pattern with and without the fibonacci retracement tool, and the way to trade a bearish alt bat harmonic chart pattern.
How to draw/find a bearish alt bat harmonic chart pattern on price chart?
To draw a bearish alt bat harmonic chart pattern, first of all we need to find the X and A points of the pattern. X and A points of the pattern is found at the top and bottom of a bearish trend respectively. In the second step, we will draw a fibonacci retracement tool from X to A to find the B point of the pattern. The B point should be at the 38.2% fibonacci retracement of XA.
To find the B point without fibonacci retracement tool, we will use the following formulas-
(IA) AB= (price at X point-price at A point) X 0.382
(IB) Price level at 38.2% of XA= (result found from formula (IA) + price at point A)
(IB) Price level at 38.2% of XA= (result found from formula (IA) + price at point A)
The B point of this pattern should lie on the price levels found from formula (IB). This satisfies the AB/XA=0.382 condition of the pattern. Look at the following illustration.

In the above image, we can see a little failure in confirming the B point of the pattern. B point is confirmed little higher than the 38.2% fibonacci retrcement level of XA, but still we will accept it as the B point of bearish alt bat harmonic chart pattern. We will find so many cases similar to this while analyzing the price chart.
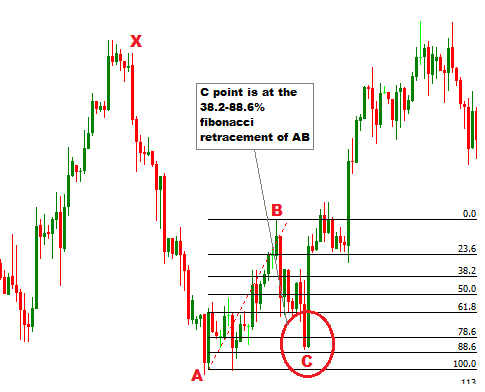
In the next step, we are going to find the C point of the pattern. to find the C point of the pattern, we will draw a fibonacci retracement tool from A to B. The C point should be between the 38.2% and 88.6% fibonacci retracement of AB.
To find the C point without fibonacci retracement tool, we will use the following formulas-
(IA) BC= (price at B point-price at A point) X 0.382(IB) Price level at 38.2% of AB= (price at point B-result found from formula (IA))
(IIA) BC= (price at B point-price at A point) X 0.886
(IIB) Price level at 88.6% of AB= (price at point B-result found from formula (IIA))
The C point of this pattern should lie between the price levels found from formula (IB) and (IIB). This satisfies the BC/AB=0.382-0.886 condition of the pattern. Look at the following illustration.
In this step we are going to find the D point of the pattern, to find the D point, we need to draw a fibonacci retracement tool from B to C. The D point should be between the 200 and 2.618% fibonacci retracement of BC.
To find the D point without fibonacci retracement tool, we will use the formulas-
(IA) CD= (price at B point-price at C point) X 2.0
(IB) Price level at 200% of AB= (price at point C+result found from formula (IA))
(IIA) CD= (price at B point-price at C point) X 2.618
(IIB) Price level at 261.8% of AB= (price at point C+result found from formula (IIA))
(IA) CD= (price at B point-price at C point) X 2.0
(IB) Price level at 200% of AB= (price at point C+result found from formula (IA))
(IIA) CD= (price at B point-price at C point) X 2.618
(IIB) Price level at 261.8% of AB= (price at point C+result found from formula (IIA))
The D point of this pattern should lie between the price levels found from formula (IB) and (IIB). This satisfies the CD/BC=2.00-2.618 condition of the pattern. Look at the following illustration.

Now we need to reconfirm the D point of the pattern. To reconfirm the D point, we will draw a fibonacci retracement tool from X to A. The D point should be at the 113% fibonacci retracement of XA.
To find the D point without fibonacci retracement tool, we will use the formulas-
(IA) AD= (price at X point-price at A point) X 1.13
(IB) Price level at 113% of XA= (price at point A+result found from formula (IA))
The D point of this pattern should lie between the price levels found from formula (IB). This satisfies the AD/XA=1.13 condition of the pattern.
(IA) AD= (price at X point-price at A point) X 1.13
(IB) Price level at 113% of XA= (price at point A+result found from formula (IA))
The D point of this pattern should lie between the price levels found from formula (IB). This satisfies the AD/XA=1.13 condition of the pattern.

How to trade bearish alt bat harmonic chart pattern?
A short entry is suggested when the D point of the pattern in confirmed. The stop loss for the order should be placed at the upper resistance level. The take profit for the order should be placed at the 38.2-88.6% fibonacci retracement of CD, depending on the fundamental analysis.
B and C points can also be traded, if the entries are confirmed by other technical analysis tool(s).
Dear Traders,
If you want to join the discussion with other traders, you can drop a comment below. You can also subscribe yourFXguide to receive updates right into your inbox.
Thank You and Good Luck.


No comments: